With one month to go before the end of the year and the decade, I just wanted to get a picture of which assets, sectors, industries… performed well so far in 2019. Through the mentoring program, I strongly advise my mentees to get a price action picture at least every week. The idea is to […]
Archives for November 2019
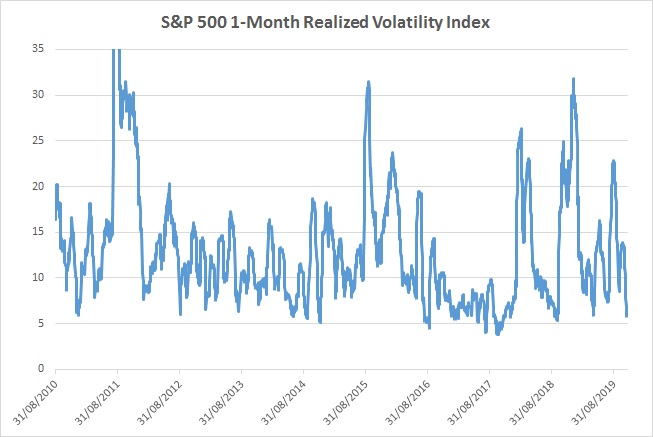
Realized Volatility vs Implied Volatility. Where are we?
I just wanted to make a quick comment on market’s conditions as we recently experienced falling volatility. That is true across asset classes where volatility stands at low level. Below we will be looking at the S&P 500 volatility: realized and implied. Let’s start with a chart for the S&P 500 1month Realized Volatility: For […]

Buybacks, Dividends and Free Cash Flows
In a recent post (https://ftalphaville.ft.com/2019/11/13/1573644284000/A-quick-look-at-US-buybacks/) FT Alphaville discussed buybacks. With 2020 in sight and the U.S. Presidential Campaign, we will read more and more similar headlines. If you add debates around how real wages have increased (or not) over the last 10 years or the different social widening gaps, you can be certain that you […]
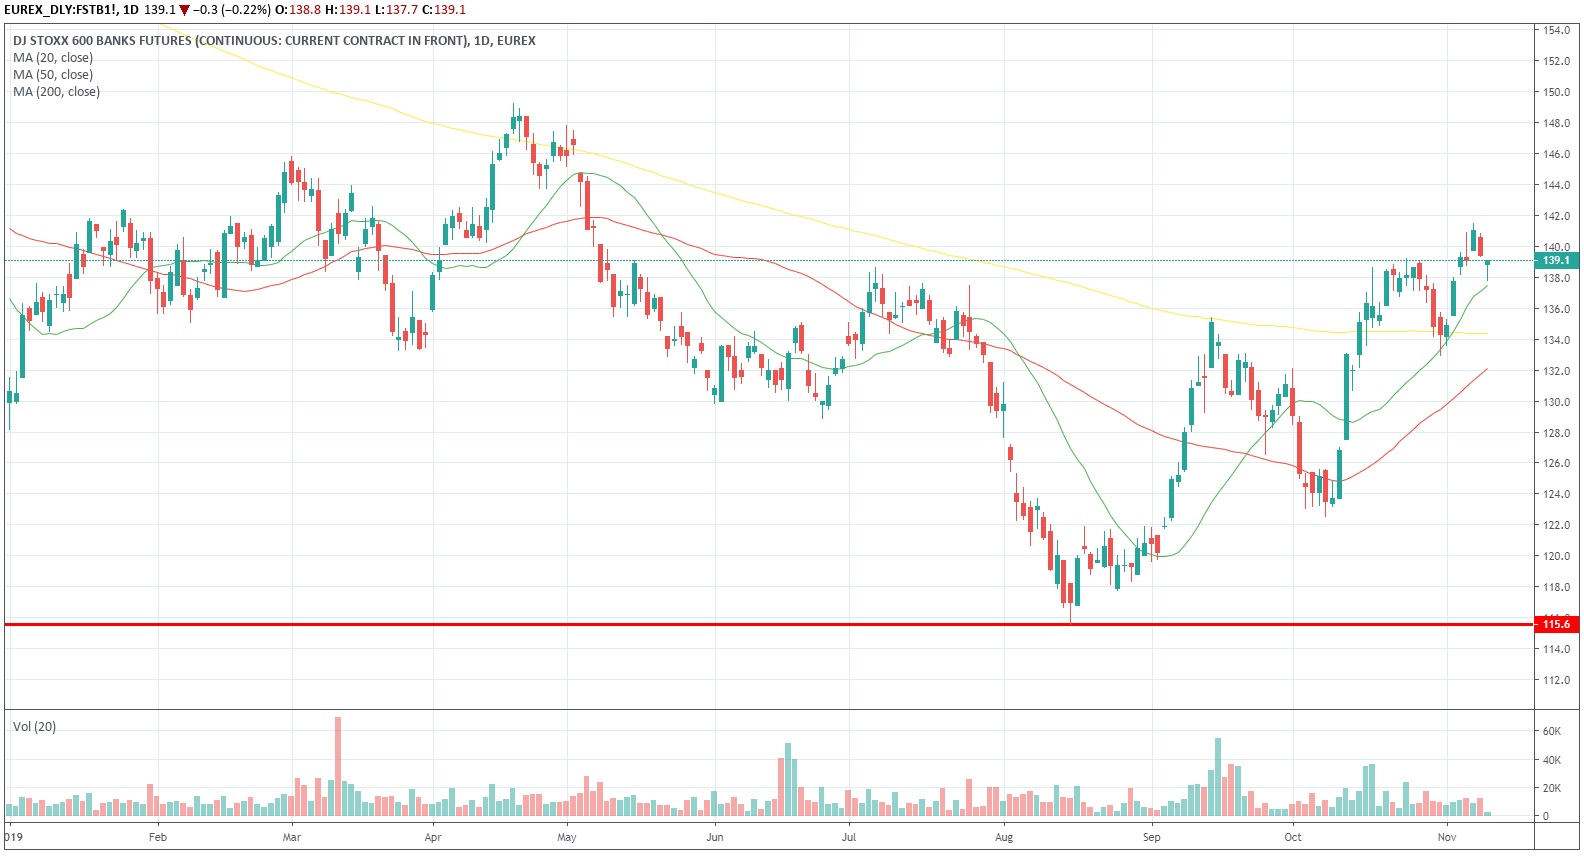
The 2nd Derivative – A Follow up: HSBC example.
Let’s start with the Europe Stoxx 600 Banks Chart in 2019: Now HSBC in eur in 2019: And HSBC in GBP: About to retest a big support. Now what about HSBC exposure by regions: Hong Kong 19.90% United Kingdom 12% Asia 13.50% United States 5.10% Latin America 3.50% Middle East and North […]

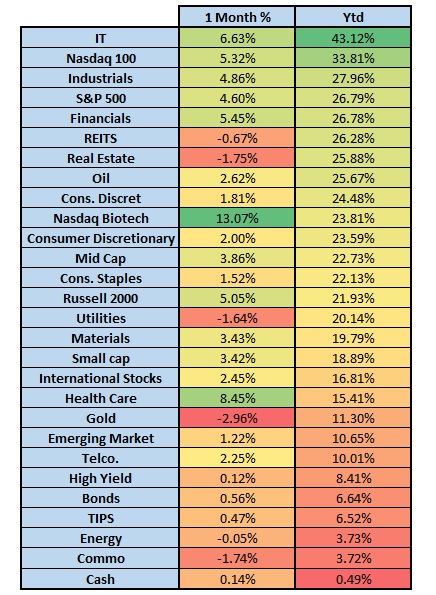
October Snapshot and random charts
Let’s start with Performances in October across asset classes and sectors. Then (random) charts only. XLU – Utilities Health Care vs S&P 500 Information Technology vs S&P 500 Energy vs S&P 500 I hope it helps, Gregoire